3 minutes
Github Contribution Graph Grafiti
Introduction
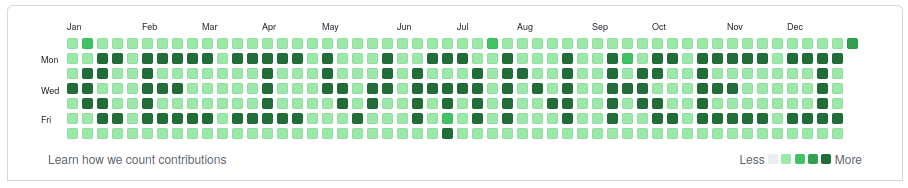
Whenever you open someone’s profile on Github, it shows you a neat summary of all the historical contributions that you have done and showcases it as a neat 53x7 grid. The grid shows the number of commits and other interactions that the user performed on each day over the last year.
Since I have started working professionally and I use a different Github account for it, the contribution graph on my personal Github account has been quite empty lately. Here’s a look at my contribution graph before I decided to draw my name all over it :P

While I do intend to change the near empty commit history and start making more open-source contributions as well as work more on personal projects on my Github, I wanted to see if I could maybe hack the graph to display something interesting in the meantime?
While some might question if this is ethical to do, here’s my take on it:
- The commit graph is a not an indicator of a profile’s importance, it does not showcase commits one makes to their private repositories or to another source control systems. While some companies do review people’s Github commit history as a selection criteria, I do not support that metric as a good idea. Looking at the profile commit history and projects contributed to is much more important in my opinion. Also the first thing that came to my mind when I saw the contribution graph was that it is an awesome open pixel canvas and it would be so cool to draw a pixel diagram here, keeping that in mind, I don’t think it’s unethical and hence going ahead with anyways.
Execution
So having worked with git and Github before, I already had an rough idea that Github allows you to import old repos to their platform, so I was pretty sure that they must allow you to fake the dates on a commit somehow and probably that showed up on the contribution graph as well. Turns out that faking the date is very simple, you just need to set the GIT_AUTHOR_DATE and GIT_COMMITTER_DATE environment variables. So doing this seems to be quite easy, I was all set to writeup my own script to do this. But just a quick web search before that made me aware of many projects already existing that do this.
The one I found to be most polished was gitfiti. This project allows you to interactively create a bash script that you can run manually and create the contribution graph. This is exactly what I wanted, just a few minor things that were missing were an ability to continously loop the design and include commits into the future so that I can run this once and be rest assured that my grafiti will be there for years to come without any need for my intervention!
You can find the code I wrote for this here. And to see the commits that I made using the script, look at this repo. With the commits made till the year 2037, repeating “Keivan” 50 times across the grid, I think I am free from the curse of empty contribution graphs for quite a few years for now :P
Result
Overall the graph does look nice and much better than having a blank diagram. I do have a few ideas to improve upon this further, but maybe next time?
Future Ideas
- Come up with something more creative than just drawing my name over the grid?
- Instead of hacking this to make all the commits at once, can we make use of scheduled Github Actions to carry out a few commits on my behalf and populate the graph?
Acknowledgments
626 Words
02-01-2022